What Is Trend Analysis in Financial Statement Analysis

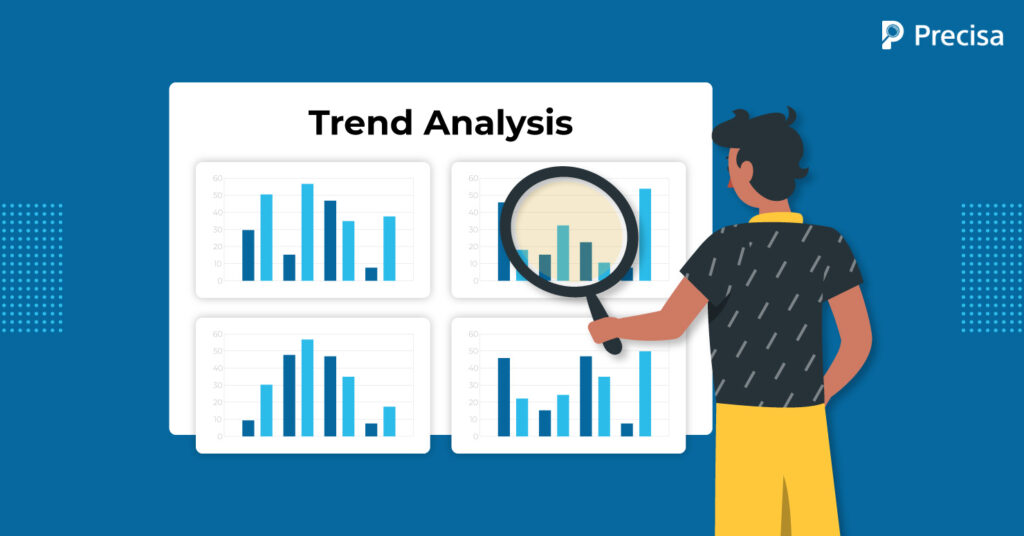
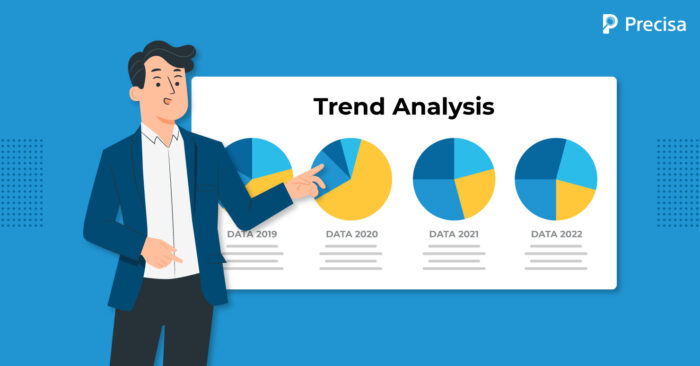
Trend analysis is a technique for creating precise predictions based on historical data and analysis. It enables comparing data over a specific time frame and detecting uptrends, downtrends, and stagnation. In financial statement analysis, trend analysis involves evaluating an organisation’s financial information over time.
Depending on the situation, periods might be counted in months, quarters, or years. The goal is to calculate and analyse the amount of change and per cent change from one period to the next.
Financial statement analysis enables information analysts to identify percentage changes in the chosen data over time. It helps determine whether a company’s net profit is increasing, decreasing, or stable if there are variations over time.
Let us elaborate on trend analysis and some of its significant aspects.
An Overview of Trend Analysis in Financial Statement Analysis
According to the Reserve Bank of India (2024), digital lending transactions in India surged by 32% year-on-year, creating more robust datasets for real-time financial insights. Similarly, India’s fintech sector is projected to reach $150 billion by 2025, further accelerating access to timely financial data.
Identifying trends in the data to make more accurate predictions is critical in any industry.
- Recognising these financial trends enables a company to understand its accounting practices and improve financial planning and performance. The ability to identify market trends aptly can immensely benefit your investment strategy.
- Within the financial industry, trend analysis is a broad term, as it uses multiple metrics and methods, including the horizontal analysis of financial statements and the technical trend analysis of stocks.
- Also, the results of other financial analyses like horizontal and vertical analyses, variance analysis, profitability analysis, etc., are often incorporated to provide more context for analysing these trends.
Financial Statement Analysis: How Can Trend Analysis Help CFOs Make Insightful Decisions?
Trend analysis enables CFOs in India to track and interpret patterns in financial data across multiple periods. By analysing key line items—such as revenue, expenses, net profit, and assets—over time, CFOs gain a longitudinal view of company performance. Here’s how trend analysis empowers CFOs:
1. Detecting Financial Health Patterns
Tracking financial trends reveals whether performance metrics are improving, stable, or deteriorating. For instance, a consistent rise in operating costs without a corresponding increase in revenue could indicate inefficiencies.
In India, where industries face fluctuating input costs and regulatory changes, identifying such red flags early is crucial for course correction.
2. Strategic Forecasting & Budgeting
It forms the backbone of forecasting models. By understanding how costs and revenues behave seasonally or cyclically, CFOs can make more accurate budgets and projections.
3. Performance Benchmarking
CFOs can use trend analysis to benchmark internal performance year-over-year or compare subsidiaries and business units. In diversified conglomerates, this enables clearer allocation of capital and performance-based resource management.
4. Investor Confidence & Compliance
Investors and stakeholders in India often demand consistent financial transparency. Trend analysis in financial reports demonstrates data-driven management, which boosts investor confidence and satisfies disclosure norms mandated by SEBI or the Companies Act.
5. Risk Management
By identifying negative trends—like rising debt levels or declining margins—CFOs can proactively manage risks. For instance, trend lines showing a shrinking working capital could prompt renegotiation of supplier terms or adjustments to inventory levels.
To add, collecting data from various periods is necessary for the trend analysis process, also known as time series analysis. The gathered data is then horizontally analysed and plotted to identify trends.
With cloud-based fintech tools, CFOs can tap into traditional financial metrics and alternative datasets to enhance trend interpretation. A 2025 survey by the Indian Banks’ Association found that 68% of CFOs in large Indian enterprises use automated trend analysis platforms to inform real-time financial planning and strategy.
What is Horizontal Analysis?
Trend analysis in financial statement analysis is a statistical tool to show how certain elements have changed over time. The primary difference between vertical and horizontal analysis is that vertical analysis focuses on the relationships between the numbers in a single reporting period or one moment in time.
On the other hand, horizontal analysis is a method where financial statements are compared to reveal financial performance over a specific period of time. The comparative statement is then used to highlight any increases or decreases over that particular time frame.
This enables you to easily spot growth trends and any red flags that need to be addressed. As the horizontal analysis looks at trends over time on various items on financial statements, it is also referred to as trend analysis.
Advantages of Using Trend Analysis in Financial Statement Analysis
1. Inter-Company Comparisons
The analyst can properly compare two or more companies over time with the help of trend analysis, and it can also be contrasted with the industry standard. In other words, it helps to understand a particular company’s strengths or weaknesses compared to similar companies in the industry.
The management can make decisions based on trend analysis (in terms of percentages), which is considered more effective than mere numbers or data.
Therefore, trend analyses are constructive for comparing data to assess a company’s financial performance over time and to assist management in making decisions that will affect the future while predicting it.
2. Estimating Liquidity and Solvency
With the aid of related financial trend measures, trend analysis enables analysts and management to comprehend a company’s long-term solvency and short-term liquidity position over time.
3. Measuring Profitability Position
With the use of related financial trend ratios like the Operating Ratio, Net Profit Ratio, and Gross Profit Ratio, trend analysis also aids in measuring the profitability positions of an enterprise or a company through time.
Disadvantages of Trend Analysis in Financial Statement Analysis
While valuable, trend analysis has limitations that must be acknowledged for balanced decision-making.
1. Selection of the Base Year
The base year must be chosen carefully. Typically, any year can be used as the basis for a financial statement analysis. However, selecting a base year to identify the trend takes a lot of work to break down comparisons or trends accurately.
2. Consistency Issues
Following a consistent accounting principle and policy is also highly challenging, especially given how quickly commercial accounting trends switch.
3. Ineffective under Inflationary Conditions
Analysing trend percentages when prices change frequently is meaningless, especially during economic turmoil or inflation. Data trends that are used for comparison will produce incorrect results.
Final Note
Before a financial statement analysis, it’s essential to understand what type of trend analysis the company wants to perform. Choosing which market, sector, or asset to employ is the primary stage in the research.
The company must also decide the period based on the goal and the relevant previous financial data.
The next step is to choose the type of trend analysis to perform and the platform to be used, and confirm that the financial data needed is readily available.
Precisa’s Bank Statement Analyser is designed to help businesses access verified, structured financial data with ease, enabling smarter credit assessments and trend identification. If you are looking to sharpen your financial strategies and stay ahead of market shifts, Precisa is ready to support your journey.
Get in touch with us today and see how deeper financial insights can transform your growth path.


