Understanding Bank Financial Statement Analysis: Excel’s Role and Limitations

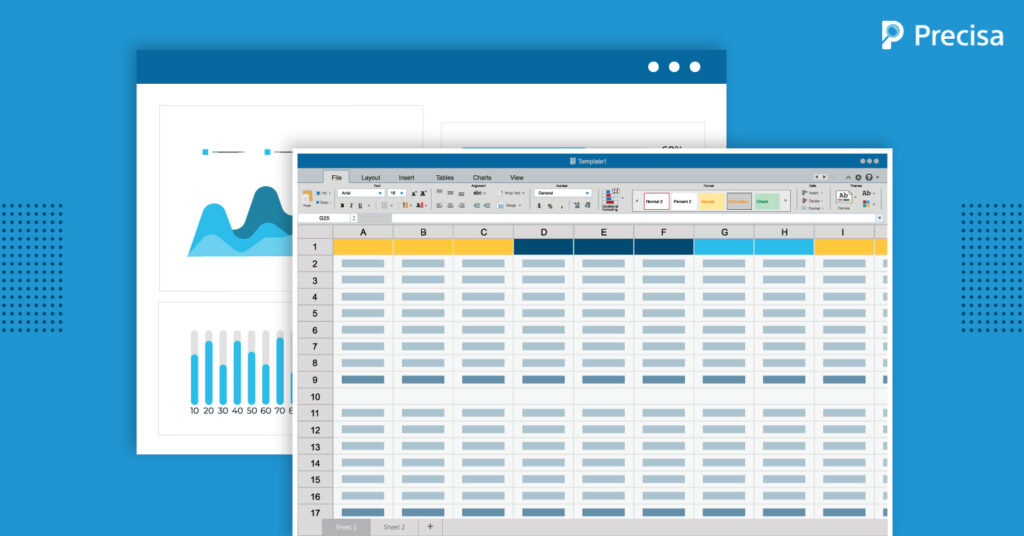
Despite the arrival of cutting-edge technologies, including artificial intelligence (AI), robotic process automation (RPA), and big analytics, Microsoft Excel still commands a firm grip over financial companies. Even today, analysts at Wall Street continue to rely on Excel sheets primarily due to their reliability, long history of use, and, sometimes, the sheer aversion to switching to new tools. However, despite this dominance, modern bank financial statement analysis using Excel has stood the test of time, and as things stand, it is becoming one of the most popular tools among financial experts and professionals.
This article sheds light on the current state of bank financial statement analysis with Excel, the drawbacks of overly leaning on Excel for financial statement analysis and other related aspects.
Let’s begin by finding answers to what makes Excel so appealing nearly 40 years after its launch.
Why is Excel Still Relevant?
It is fair to say that Excel’s relevance as a software across various industries is still largely intact. Organisations and professionals predominantly depend on it for a wide variety of tasks, including financial analysis, reporting, and financial modelling.
Additionally, although Microsoft has added new features and functions, long-term users appreciate the consistency of the tool, as most basic functions are largely the same as they forever were.
Simply put, Excel’s familiarity, robust functions, and ease of use make it appealing to perform different applications, including bank financial statement analysis.
Bank Financial Statement Analysis with Excel – Primary Users
Now, let’s look at the primary users of bank financial statement analysis Excel.
1. Financial Institutions
Financial institutions such as banks and non-banking financial companies (NBFCs) use Excel to quickly analyse financial statements to determine an organisation’s financial health. This enables them to evaluate whether they should sanction a loan, offer equity investment, and underwrite bond offerings.
2. Businesses
Bank financial statement analysis with Excel offers precious insights into a company’s financial performance for a stipulated timeframe, financial stability, growth, revenue leakages, and profitability, empowering them to make informed financial decisions.
3. Financial Analysts
Financial analysts sieve through a company’s financial statements to spot patterns, evaluate its financial health, and identify growth areas and underlying issues that require immediate attention.
Advantages of Bank Financial Statement Analysis Using Excel
Microsoft has left no stone unturned to ensure Excel stays relevant and is a significant component of data and financial analysis workflows. Let’s explore some of the top advantages of using Excel for bank financial statement analysis.
1. Easy to Get Started
One of the primary reasons behind Excel’s popularity is that it is relatively easier to hit the ground running and get on with essential tasks almost immediately.
2. Formulas
Professionals enjoy working on Excel due to the wide range of formulas built inside the application. It also takes a few seconds to create custom formulas in case you need to make specific calculations.
3. Tables
Creating and working with tables in Excel offers unparalleled data validation, visualisation, and financial analysis capabilities, driving efficiency.
Also, users can choose from around 50 predefined table styles and custom column formats to automate column calculations during bank financial statement analysis using Excel.
4. Scalability
From a single-line worksheet to worksheets with up to 1,048,576 rows and 16,384 columns, Excel is one of the most effective and capable tools for performing financial statement analysis.
5. Collaboration
Excel is also an excellent collaborative tool, as it is easy to share Excel worksheets with relevant stakeholders, allowing multiple users to edit the file as and when required.
Bank Financial Statement Analysis using Excel: Some Drawbacks
While there is no doubt that Excel offers many benefits and is arguably one of the most efficient tools for performing bank financial statement analysis, unfortunately, there are a few drawbacks:
1. Multiple Versions of One File
Since Excel is not a cloud application, users must create a new file version every time they update or make changes. Many financial institutions struggle to deal with this issue as it leads to version control challenges and tracking the changes over time.
2. Mastering Excel is Time-consuming
While it is easy to get going for new users, there is a learning curve involved if you wish to go beyond the basic Excel functions and formulas. If you aim to use pivot tables, macros, and complex formulas, you must dedicate considerable time and effort to learning them.
3. Compromised Error Detection
Bank financial statement analysis with Excel can become time-consuming and tedious. Here’s how. It is very challenging to spot errors, mainly when dealing with large data sets, eventually missing out on significant discrepancies, resulting in inaccurate financial analysis.
4. Creating Reports Takes Time
Financial professionals continuously analyse data to create month-end, quarterly, and annual reports. Many ‘heavy-user’ financial analysts have stated that they spend almost a week creating reports, impeding their ability to focus on other critical tasks.
Wrap Up
Excel was, is, and hopefully will continue to be a trusted ally for financial professionals who use the tool for analysing bank statements and other financial data. The tool’s accessibility and versatility have made it indispensable and stand against the test of time.
That said, we must also remember that it has limitations, particularly while dealing with large datasets and the need for real-time collaboration.
To solve this, Precisa’s cloud-based Bank Statement Analyzer collects, categorises, and analyses data from bank statements, uncovers fraudulent transactions accurately, and exports these essential insights to Excel for businesses that prefer working with a familiar tool.
Book a demo today to know more!


