
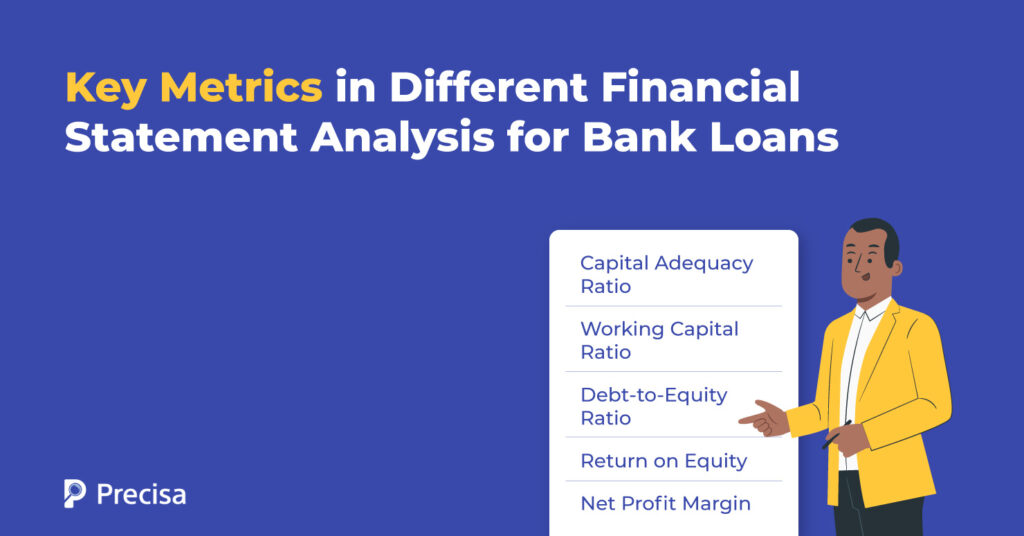
Key Metrics in Different Financial Statement Analysis for a Bank Loan
Lenders generally need to cross-examine the applicant’s financial strengths and weaknesses before approving a loan application. Financial statement analysis helps them make these decisions; it involves evaluating an applicant’s financial statements to assess their financial health and determine their creditworthiness. This includes information about the borrower’s assets, liabilities, income, and expenses. Financial statement analysis for a bank loan using various metrics helps lenders better understand the borrower’s liquidity and financial stability.
Therefore, a thorough financial statement analysis for a bank loan is integral to identifying potential red flags and preventing loan defaults. Let’s dive into the details of this process.
What Is Financial Statement Analysis?
Financial statement analysis for a bank loan is a structured approach that involves studying a company’s financial statements to gain valuable insights into its performance, stability, and overall health.
It involves examining the balance sheet, income statement, and cash flow statement to interpret past and present financial data and get a comprehensive view of the firm’s operational efficiency, liquidity, solvency, and profitability.
Lenders can assess an organisation’s ability to earn profits, manage debts, and generate cashflows. The analysis goes beyond numerical comparisons; it tries to gain a holistic view, insights into trends, and identification of anomalies.
Also, going beyond numbers offers lenders a holistic view and helps them identify potential risks and opportunities, facilitating informed decision-making.
Different metrics help lenders assess a company’s strengths and evaluate its performance against industry benchmarks. Financial statement analysis for a bank loan involves evaluating three statements: the balance sheet, income statement, and cash flow statement.
Key Metrics in Financial Statement Analysis
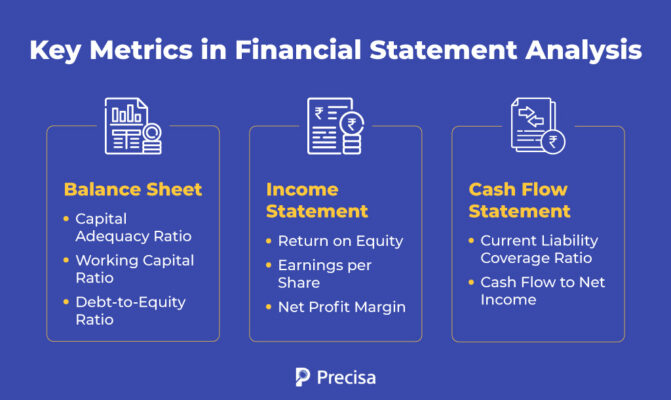
The Balance Sheet
The balance sheet reflects a company’s financial worth in terms of book value, which comprises the company’s assets, liabilities, and shareholder equity. Short-term assets, such as cash and accounts receivable, also reveal a lot about a firm’s operational efficiency.
Key metrics that a balance sheets provide are:
Capital Adequacy Ratio
Capital Adequacy Ratio (CAR) measures the degree to which the company’s capital is available to absorb unexpected losses. A higher ratio indicates a strong capital position and can be a positive indicator for lenders.
CAR=Risk Weighted AssetsTier 1 Capital+Tier 2 Capital
Working Capital Ratio
The working capital or the current ratio helps lenders assess how easily the business can meet its short-term obligations. It indicates the ratio of current assets to current liabilities of a company.
Working Capital Ratio = Current Assets / Current Liabilities
Debt-to-Equity Ratio
The debt-to-equity ratio focuses on the company’s capital structure and the extent to which the business is financed by debt compared to equity. A high debt-to-equity ratio points to a higher risk of default for the borrower.
Debt-to-Equity Ratio = Total Liabilities / Shareholders’ Equity
The Income Statement
The income statement is another financial statement that offers lenders insights into borrowers’ credit assessments. It provides details about a company’s revenue and expenses.
Bank Statement Analysis also helps provide valuable information and aids their decision-making. Lenders can use the income statement to analyse business efficiency at different points.
Here are the key metrics that an income statement provides during the financial statement analysis for bank loans:
Return on Equity
Return on equity (ROE) brings the income statement and balance sheet together. It estimates a company’s profitability regarding shareholders’ equity. ROE shows how much profit the company generates for each unit of shareholder equity.
ROE provides a simple metric for evaluating investment returns. A higher return on equity indicates a more efficient and profitable company.
ROE = Net Income / Shareholders’ Equity.
Earnings per Share
Earnings per share (EPS) indicates a company’s ability to generate net profits for common shareholders. EPS is calculated by dividing the company’s net income by its total number of outstanding shares. It helps lenders gauge the company’s profitability; the higher the earnings per share of a company, the better its profitability.
There are two ways of calculating earnings per share:
EPS= Net Income after Tax/Total Number of Outstanding Shares
Weighted EPS= Net Income after Tax – Total Dividends)/Total Number of Outstanding Shares
Net Profit Margin
The net profit margin is a comprehensive measure of a company’s profitability. It accounts for all operating expenses, interest, and taxes and shows how efficiently a company turns its revenue into profit.
A company with a higher margin indicates a strong cash flow and a higher probability of repaying loan dues. This metric is a good comparative measure of the company’s profitability over the years and its performance compared to its peers.
Net Profit Margin = (Net Profit / Revenue) x 100
The Cash Flow Statement
Analysing cash flow statements helps lenders determine whether a borrower can repay a loan. A cash flow statement details the firm’s income, expenses, and debt obligations, which are key factors in this risk evaluation.
The cash flow statement combined with the balance sheet helps lenders analyse a company’s working capital efficiency. A company with large accounts receivable and a low cash balance, even if highly profitable, could face problems in its day-to-day operations.
Metrics from the cash flow statement are:
Current Liability Coverage Ratio
The current liability coverage ratio measures how much money the business has to pay its debt. This ratio, also known as the cash current debt coverage ratio, measures a company’s liquidity and holds special significance for financial statement analysis for a bank loan.
If the ratio is more than one, a company has enough money to pay off current liabilities; lenders can assess if the borrowers will be able to meet their debt obligations.
CLC= (Net cash from operating activities-cash dividends)/Average Current Liabilities
Cash Flow To Net Income
The cash flow to net income ratio is a valuable metric that helps lenders assess the quality of a firm’s earnings, solvency and payment capacity. The ratio indicates a business’s capacity to generate cash and support itself without additional debt.
Here’s the formula for calculating the cash flow to net income ratio:
Cash flow to net income = CFO / Net Income
To Sum It Up
Financial statement analysis for a bank loan is a powerful arrow in the lender’s quiver and helps improve their decision-making and reduce defaults. Metrics like the Capital Adequacy Ratio, Debt-to-Equity Ratio, Earnings per Share, Net Profit Margin, Cash Flow To Net Income, Current Liability Coverage Ratio and more help lenders improve their portfolio quality.
Lenders can benefit from AI-powered financial statement analysis tools. Precisa’s cloud-based Bank Statement Analyser is a unique solution that combines AI and ML. It offers deep, actionable insights using uploaded bank statements, helps lenders improve productivity, and mitigates their overall risk.
Get in touch with our team to learn more about its benefits and features today!