B2B vs B2C Sales Patterns: What Bank Statements Reveal

When you review bank statements, similar-looking applications can hide very different business models. One applicant might show dozens of small daily credits totalling ₹50,000, whilst another receives just three large payments of about ₹15 lakhs a month. The revenue is similar, but their risk profiles aren’t the same.
Bank statements reveal the difference between B2B and B2C cash flow patterns. For NBFCs and financial institutions, reading these patterns well can be the difference between profitable lending and costly defaults.
This article explores how bank statement analysis brings out these differences and strengthens credit assessment.
Understanding B2B and B2C Business Models
Before diving into bank statement patterns, you need to understand these two fundamental business models.
- B2B (Business-to-Business): Companies sell products or services to other businesses. A manufacturer supplying parts to automobile companies or a SaaS company selling software to enterprises operates as B2B.
- B2C (Business-to-Consumer): Companies sell directly to individual consumers. Retail shops, restaurants, and e-commerce platforms selling to shoppers are B2C businesses.
These models differ fundamentally in how they generate revenue. These differences show up clearly in bank statements.
Key Transaction Pattern Differences in Bank Statements
A closer look at bank statements reveals distinct transaction behaviours:
Transaction Frequency and Volume
B2C businesses show high transaction counts with small ticket sizes. For example, a restaurant may handle 200 daily payments of ₹500–₹2,000. Their bank statements show constant activity, and money flows throughout operating hours.
B2B businesses process fewer transactions but with higher value. A supplier may invoice just 10–20 clients a month, with amounts ranging from ₹50,000 to ₹50 lakhs. Their bank statements show sporadic large deposits rather than constant small ones.
Payment Timing and Terms
B2C payments settle almost instantly through cards, UPI, or wallets, so their bank statements reflect revenue in real time. There’s little delay between a sale and the cash hitting the account, with most gateway settlements completed within 24-48 hours.
B2B companies, however, operate on credit cycles such as Net 30, Net 45, or Net 60. As a result, 30–60 days may pass between invoicing and actual payment, and their bank statements often show long gaps between sales activity and cash inflows.
Transaction Regularity and Predictability
B2C revenue is generally predictable, though seasonal spikes occur during festivals or weekends.
B2B cash flow is far less regular. Large contracts can create sudden one-off deposits (such as a ₹1 crore annual deal) followed by quieter months, making forecasting more challenging.
Cash Flow Patterns That Differentiate B2B from B2C
Bank statement analysis reveals how businesses manage their cash flows:
Working Capital Requirements
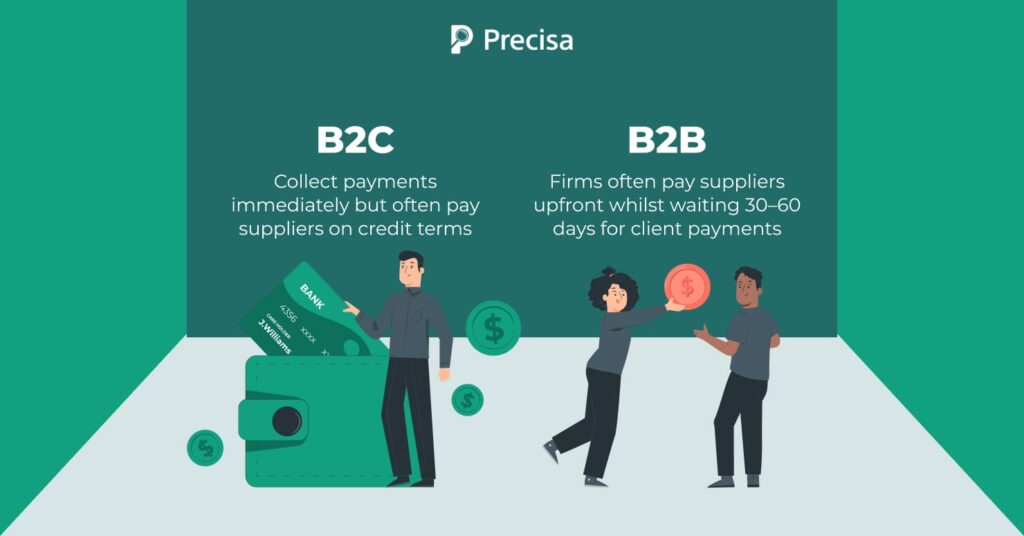
B2C businesses maintain faster cash conversion cycles. They collect payments immediately but often pay suppliers on credit terms. This creates positive working capital, and the cash balance generally remains stable.
B2B firms often pay suppliers upfront whilst waiting 30–60 days for client payments, creating cash gaps. Their statements reflect large outflows followed by long periods with no matching inflows.
Revenue Concentration
Bank statement analysis also highlights concentration risk.
B2C revenue is widely distributed across many customers, with no single buyer contributing more than 1–2%. This appears as highly diversified transaction sources.
B2B companies depend on a few large clients, with individual clients sometimes contributing 20–40% of total revenue. If a major client leaves, their revenue drops dramatically. This concentration increases lending risk.
Seasonal Fluctuations
Both models experience seasonality, but in different ways.
B2C patterns are predictable: retail peaks during festivals, food businesses during weekends or summers. Past bank statements help lenders anticipate these cycles.
B2B seasonality depends on client industries, such as construction slowdowns during the monsoon season or manufacturing spikes at year-end. These are harder to predict and require sector-aware bank statement analysis.
Expense Patterns That Reveal Business Models
Bank statement analysis also reveals cost structures through recurring expense patterns.
Fixed vs Variable Cost Structure
B2C companies run on higher variable costs—inventory, payment fees, packaging—so expenses rise and fall with revenue. Bank statements reflect this proportionality.
B2B firms carry higher fixed costs, especially salaries for sales and account teams. Their statements show steady monthly payroll outflows that persist even when revenue drops, increasing pressure during slow periods.
Marketing and Customer Acquisition Costs
B2C businesses make frequent, smaller payments to digital advertising platforms and agencies, spreading marketing spend across many channels.
B2B companies show fewer but higher per-customer acquisition costs tied to trade shows, conferences, and business development travel. Though costlier per customer, these clients typically deliver higher lifetime value.
Payment Method Patterns in Bank Statements
The payment methods visible in bank statements differ significantly
Preferred Payment Channels
B2C businesses use diverse digital channels: payment gateways such as Razorpay, PayU, and Paytm, along with daily card settlements and real-time UPI inflows. This indicates healthy adoption of digital transactions.
B2B firms rely mainly on RTGS/NEFT transfers and high-value cheque deposits, which still appear frequently for transactions above ₹10 lakhs.
Payment Splitting and Instalments
Bank statement analysis of B2B accounts often reveals milestone-based payments. Large projects are split into multiple instalments, such as repeated ₹20 lakh deposits from the same client. This signals long-term contracts.
B2C statements rarely show such patterns. However, you might see BNPL (Buy Now Pay Later) platform settlements. These indicate consumer financing options.
Risk Indicators Visible in Bank Statements
Automated bank statement analysis tools help you identify key risk indicators like:
Cash Flow Volatility
B2C businesses show steady, predictable cash flow. Large ,sudden drops signal risk.
B2B cash flow swings widely due to big contracts, but unexplained missing deposits are red flags.
Return and Refund Patterns
Bank statement analysis shows B2C refunds regularly but usually under 2–3%. Rising refund rates indicate quality issues.
B2B refunds are rare but serious, often signalling major contract problems. Advanced tools flag such anomalies automatically.
Bounce and Dishonour Patterns
Bounce activity is a strong stress indicator in both models.
Frequent cheque bounces reflect financial stress. Even 2–3 bounces a month sharply increase default risk. Incoming bounces also matter, as they indicate financially weak customers and higher indirect risk.
How to Analyse These Patterns for Lending Decisions
To turn these insights into actionable credit decisions, NBFCs rely on automated analysers and several analytical steps:
Automated Transaction Categorisation
Modern bank statement analysis tools auto-classify thousands of transactions into revenue, expenses, taxes, salaries, EMIs, and more. Work that once took weeks now happens in minutes.
For example, Precisa’s bank statement analysis tool categorises transactions into 100+ categories, identifies recurring B2B client payments, and separates B2C gateway deposits, enabling accurate cash flow evaluation.
Counterparty Analysis
Understanding who the business transacts with reveals important insights. For B2B firms, this highlights client concentration risk; whilst for B2C businesses, it reveals supplier consistency.
Precisa’s counterparty detection feature automatically generates monthly reports showing receipts and payments to each counterparty. This helps lenders quickly identify top revenue contributors.
Pattern Recognition and Anomaly Detection
AI detects deviations from normal patterns such as missed salaries, skipped GST payments, or unexplained large deposits. It also flags circular transactions and unusual counterparties.
Precisa’s platform flags these irregularities automatically, detecting circular transactions (where money moves between related accounts artificially) and identifying sudden large deposits from unknown sources.
Final Thoughts
Bank statements reveal how a business truly operates, including its cash flow cycles, transaction patterns, and whether it follows a B2B or B2C model. For NBFCs, these insights enable smarter lending, better product design, and early fraud detection, far beyond what traditional credit scores provide.
With AI-driven bank statement analysis, thousands of transactions can be processed in minutes, highlighting risks and patterns humans may miss. Applying the right standards for each model reduces defaults and improves portfolio quality.
Ready to strengthen your credit assessment process? Precisa’s bank statement analysis tool, trusted by 1000+ clients across 25+ countries, processes 850+ bank formats and analyses complex B2B and B2C patterns automatically.
Start your free trial today or try Precisa for free to see how it can transform your lending decisions.